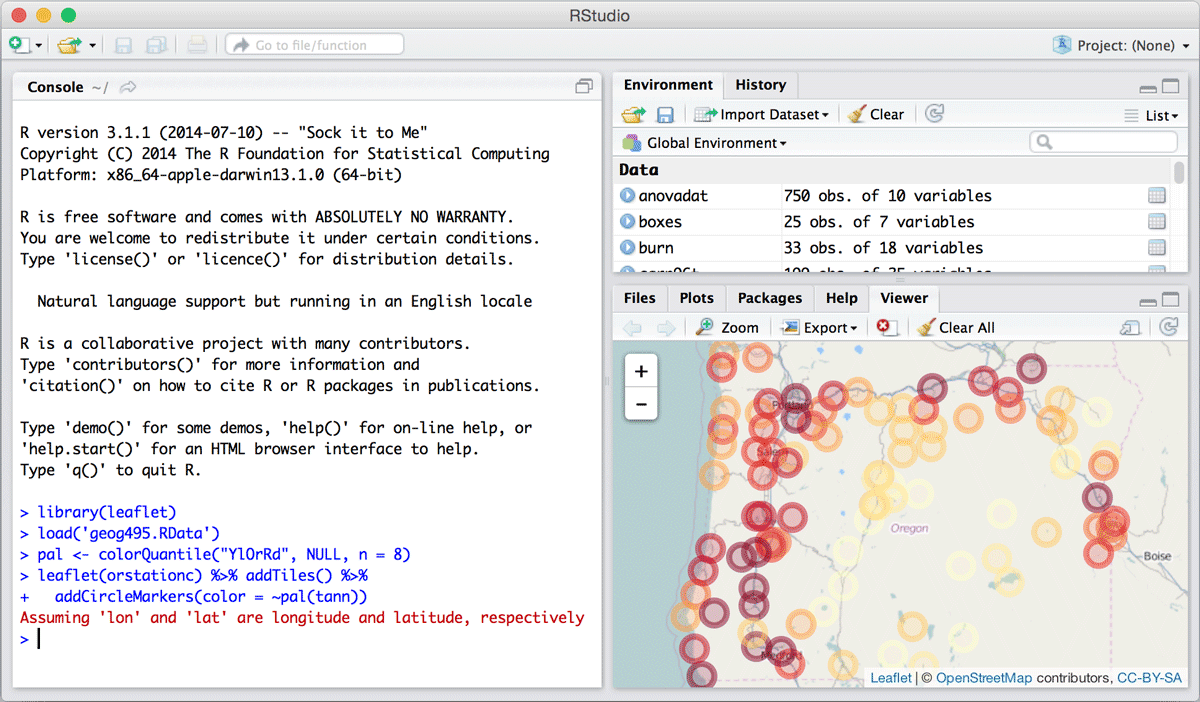
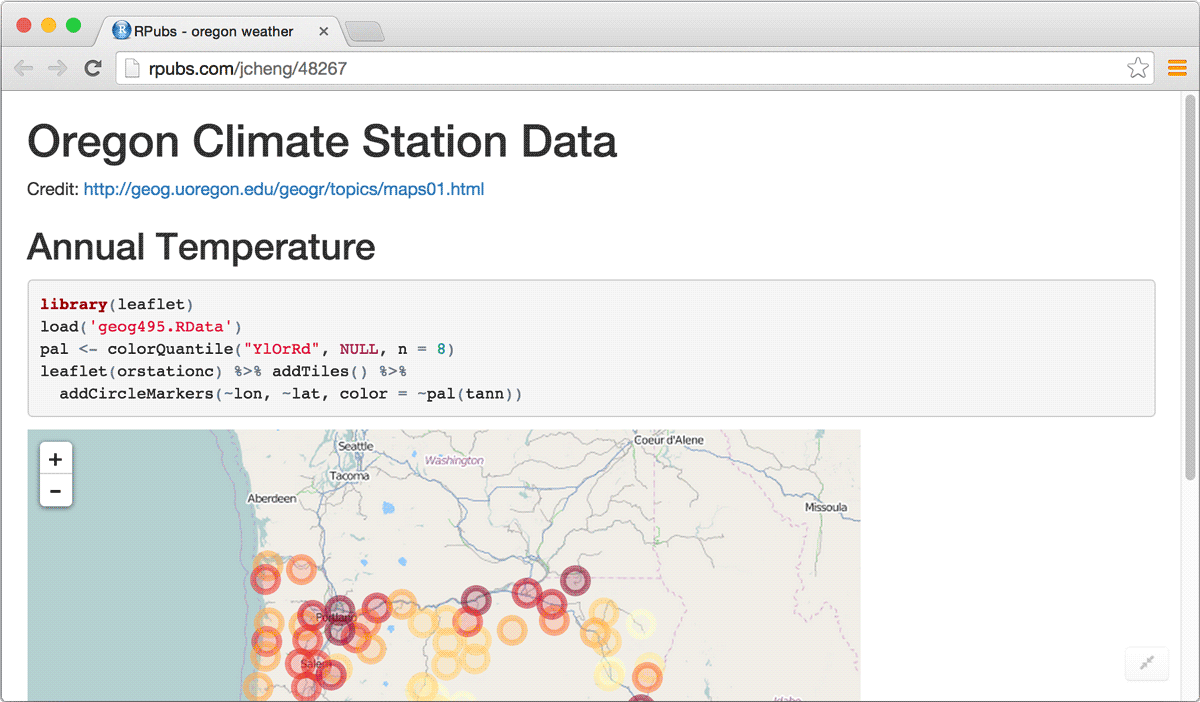
HTMLWidgets
Binding JS Libraries Made Easy
Tale of Two Plots
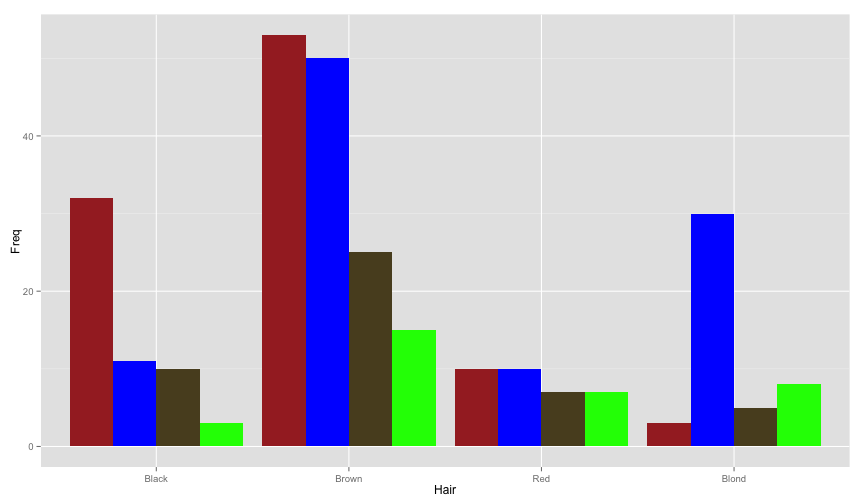
ggplot(males, aes(x = Hair, y = Freq, fill = Eye)) +
 geom_bar(position = 'dodge', stat = 'identity') +
 scale_fill_manual(
   values = c('brown', 'blue', '#594c26', 'green')
 ) +
 theme(legend.position = 'none')
<!DOCTYPE html>
<html>
<head>
<meta charset="utf-8"/>
<script src="lib/htmlwidgets-0.3.2/htmlwidgets.js"></script>
<script src="lib/angular-1.2.20/angular.min.js"></script>
<script src="lib/d3-3.4.11/d3.min.js"></script>
<link href="lib/nvd3-1.1.15/nv.d3.css" rel="stylesheet" />
<script src="lib/nvd3-1.1.15/nv.d3.min.js"></script>
<script src="lib/angular-nvd3-0.0.9/angular-nvd3.min.js"></script>
<link href="lib/ghbuttons-1.0.0/gh-buttons.css" rel="stylesheet" />
<link href="lib/ghbuttons-1.0.0/better-select.css" rel="stylesheet" />
<script src="lib/datgui-0.5.0/dat.gui.min.js"></script>
<script src="lib/nvd3-binding-0.1/nvd3.js"></script>

</head>
<body>
<div id="htmlwidget_container">
  <div id="htmlwidget-1329" class="nvd3" width="100%" height="400">
    <div ng-controller="myCtrl1329">
      <div>
        <form id="controls-for-htmlwidget-1329"></form>
      </div>
      <nvd3 options="options" data="data" api="api"></nvd3>
    </div>
  </div>
</div>
<script type="application/json" data-for="htmlwidget-1329">{ "x": {
 "y": "Freq",
"type": "multiBarChart",
"group": "Eye",
"x": "Hair",
"data": [
 {
 "Hair": "Black",
"Eye": "Brown",
"Sex": "Female",
"Freq":                36
},
{
 "Hair": "Brown",
"Eye": "Brown",
"Sex": "Female",
"Freq":                66
},
{
 "Hair": "Red",
"Eye": "Brown",
"Sex": "Female",
"Freq":                16
},
{
 "Hair": "Blond",
"Eye": "Brown",
"Sex": "Female",
"Freq":                 4
},
{
 "Hair": "Black",
"Eye": "Blue",
"Sex": "Female",
"Freq":                 9
},
{
 "Hair": "Brown",
"Eye": "Blue",
"Sex": "Female",
"Freq":                34
},
{
 "Hair": "Red",
"Eye": "Blue",
"Sex": "Female",
"Freq":                 7
},
{
 "Hair": "Blond",
"Eye": "Blue",
"Sex": "Female",
"Freq":                64
},
{
 "Hair": "Black",
"Eye": "Hazel",
"Sex": "Female",
"Freq":                 5
},
{
 "Hair": "Brown",
"Eye": "Hazel",
"Sex": "Female",
"Freq":                29
},
{
 "Hair": "Red",
"Eye": "Hazel",
"Sex": "Female",
"Freq":                 7
},
{
 "Hair": "Blond",
"Eye": "Hazel",
"Sex": "Female",
"Freq":                 5
},
{
 "Hair": "Black",
"Eye": "Green",
"Sex": "Female",
"Freq":                 2
},
{
 "Hair": "Brown",
"Eye": "Green",
"Sex": "Female",
"Freq":                14
},
{
 "Hair": "Red",
"Eye": "Green",
"Sex": "Female",
"Freq":                 7
},
{
 "Hair": "Blond",
"Eye": "Green",
"Sex": "Female",
"Freq":                 8
}
],
"options": {
 "chart": {
 "type": "multiBarChart",
"width": null,
"height":               400,
"xAxis": [],
"yAxis": [],
"color": [ "brown", "blue", "#594c26", "green" ]
},
"title": {
 "enable": true,
"html": "<h3 style='font-family: sanserif;'>Plot of Freq vs Hair</h3>"
},
"subtitle": {
 "enable": true,
"text": ""
},
"caption": {
 "enable": true,
"text": ""
}
},
"height":               400
},"evals": [  ] }</script>
<script type="application/htmlwidget-sizing" data-for="htmlwidget-1329">{ "viewer": {
 "width": "100%",
"height":               400,
"padding":                15,
"fill": false
},"browser": {
 "width": "100%",
"height":               400,
"padding":                40,
"fill": false
} }</script>
</body>
</html>

library(rCharts2)
nvd3(females,
  Freq ~ Hair,
  type = 'multiBarChart',
  group = 'Eye'
) %>%
  chart(color = c('brown', 'blue', '#594c26', 'green'))
library(rMaps2)
d1 <- crosslet(
  x = "country",
  y = c("web_index", "universal_access",
    "impact_empowerment", "freedom_openness"
  ),
  data = web_index,
  map = map_world(leaflet = list(url = OSM_URL))
)
How does it Work?
htmlwidgets
with RStudio and Kenton Russell
Resources
dependencies:
  - name: jquery
    version: 2.1.1
    src: "htmlwidgets/lib/jquery/dist/"
    script: "jquery.min.js"
  - name: raphael
    version: 2.1.1
    src: "htmlwidgets/lib/raphael"
    script: "raphael-min.js"
  - name: morris.js
    version: 0.5.0
    src: "htmlwidgets/lib/morris"
    script: morris.min.js
    style: morris.css
Javascript
HTMLWidgets.widget({
  type: "output",
  name: "morris",
  renderValue: function(el, x){
    x.element = el.id
    x.data = HTMLWidgets.dataframeToD3(x.data)
    new Morris[x.type](x)
  }
})
DEMOS
Multiple Contexts