Slidify
Reproducible HTML5 Slides
Ramnath Vaidyanathan
Assistant Professor, McGill
Test Features of Slidify
- Mathjax
- Layouts
- Backgrounds
- Widgets
- Overlays
- Metadata
- Embeds
Slidify
Nested Lists
Thing 1
- Point 1
- Point 2
Thing 2
- Point 3
- Point 4
Tab1
Tab2
Tab3
Setext Header
This slide shows a Setext style header.
Tables
Mardown tables contain --- and should not be interpreted as separator.
| Column X | Column Y |
|---|---|
| Row 1 | Row 1 |
| Row 2 | Row 2 |
Animated List, Ordered
This list should be animated
- Point 1
- Point 2
- Point 3
Animated List, Unordered
This list should be animated
- Point 1
- Point 2
- Point 3
Mathjax
\[
\begin{aligned}
\nabla \times \vec{\mathbf{B}} -\, \frac1c\, \frac{\partial\vec{\mathbf{E}}}{\partial t} & = \frac{4\pi}{c}\vec{\mathbf{j}} \\ \nabla \cdot \vec{\mathbf{E}} & = 4 \pi \rho \\
\nabla \times \vec{\mathbf{E}}\, +\, \frac1c\, \frac{\partial\vec{\mathbf{B}}}{\partial t} & = \vec{\mathbf{0}} \\
\nabla \cdot \vec{\mathbf{B}} & = 0 \end{aligned}
\]
\[
\mathbf{V}_1 \times \mathbf{V}_2 = \begin{vmatrix}
\mathbf{i} & \mathbf{j} & \mathbf{k} \\
\frac{\partial X}{\partial u} & \frac{\partial Y}{\partial u} & 0 \\
\frac{\partial X}{\partial v} & \frac{\partial Y}{\partial v} & 0
\end{vmatrix}
\]
Source: Background from SubtlePatterns
Layouts, Custom Metadata
This is a slide with a two column layout.
Column 1
Column 2
Background Color
This slide should have a subtle gray background.
Background Image
This slide should have a background image.
Widgets: jQuery-Quiz
This is a multiple choice question
- Choice 1
Choice 2- Choice 3 (correct)
- Choice 4
This is a hint
This is the explanation
Widgets: Bootstrap
Blocks
This is an alert info block which should render in blue
Tooltips
This is to check out tooltips in bootstrap you probably
Popover
Highlighter: Highlight JS
We can make this function more robust by adding a simple error checking statement to prevent illegal parameters from generating invalid results.
qpareto <- function(p, scale, loc) {
    if ((scale <= 0) | (loc <= 0)) {
        stop("'qpareto' parameters must be greater than zero.")
    }
    q <- loc * (1 - p)^(-1/scale)
    return(q)
}
Entering a negative parameter now raises an exception, instead of an invalid result that could silently corrupt subsequent results.
qpareto(0.4, 5, -1)
## Error: 'qpareto' parameters must be greater than zero.
We could improve this further by checking to ensure that p is a valid probability.
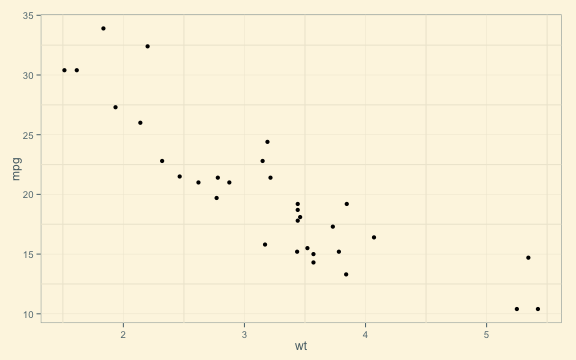
Check Chunk Execution
library(ggplot2)
library(ggthemes)
## Warning: package 'ggthemes' was built under R version 2.15.3
qplot(wt, mpg, data = mtcars) + theme_solarized()
This is a shout
I am checking key, key