        ---

<script src="http://ajax.googleapis.com/ajax/libs/jquery/1.8.3/jquery.min.js"></script>

```{r echo = F}
opts_chunk$set(cache = F)
```
Test Features of Slidify
- Mathjax
- Layouts
- Backgrounds
- Widgets
- Overlays
- Metadata
- Embeds
        ---

## Test Features of Slidify ##

<style>
/* required to display toc when bootstrap is included. */
#toc, #help {
  visibility: visible
}
#toc {
 font-family: "Helvetica";
 font-size: 14px;
}

</style>

1. Mathjax
2. Layouts
3. Backgrounds
4. Widgets
5. Overlays
6. Metadata
7. Embeds
Setext Header
This slide shows a Setext style header.
        ---

Setext Header
---


This slide shows a Setext style header.
Tables
Mardown tables contain --- and should not be interpreted as separator.
| Column X | Column Y |
|---|---|
| Row 1 | Row 1 |
| Row 2 | Row 2 |
        ---

## Tables

Mardown tables contain `---` and should not be interpreted as separator.

Column X | Column Y
---------|----------
Row 1    | Row 1
Row 2    | Row 2
Animated List, Ordered
This list should be animated
- Point 1
- Point 2
- Point 3
        ---

## Animated List, Ordered

This list should be animated

> 1. Point 1
> 2. Point 2
> 3. Point 3
Animated List, Unordered
This list should be animated
- Point 1
- Point 2
- Point 3
        ---

## Animated List, Unordered

This list should be animated

> - Point 1
> - Point 2
> - Point 3
Mathjax
\[
\begin{aligned}
\nabla \times \vec{\mathbf{B}} -\, \frac1c\, \frac{\partial\vec{\mathbf{E}}}{\partial t} & = \frac{4\pi}{c}\vec{\mathbf{j}} \\ \nabla \cdot \vec{\mathbf{E}} & = 4 \pi \rho \\
\nabla \times \vec{\mathbf{E}}\, +\, \frac1c\, \frac{\partial\vec{\mathbf{B}}}{\partial t} & = \vec{\mathbf{0}} \\
\nabla \cdot \vec{\mathbf{B}} & = 0 \end{aligned}
\]
\[
\mathbf{V}_1 \times \mathbf{V}_2 = \begin{vmatrix}
\mathbf{i} & \mathbf{j} & \mathbf{k} \\
\frac{\partial X}{\partial u} & \frac{\partial Y}{\partial u} & 0 \\
\frac{\partial X}{\partial v} & \frac{\partial Y}{\partial v} & 0
\end{vmatrix}
\]
        ---  bg:url(../../assets/img/mathematics.jpg)

## Mathjax ##

$$
\begin{aligned}
\nabla \times \vec{\mathbf{B}} -\, \frac1c\, \frac{\partial\vec{\mathbf{E}}}{\partial t} & = \frac{4\pi}{c}\vec{\mathbf{j}} \\   \nabla \cdot \vec{\mathbf{E}} & = 4 \pi \rho \\
\nabla \times \vec{\mathbf{E}}\, +\, \frac1c\, \frac{\partial\vec{\mathbf{B}}}{\partial t} & = \vec{\mathbf{0}} \\
\nabla \cdot \vec{\mathbf{B}} & = 0 \end{aligned}
$$
<br />
$$
\mathbf{V}_1 \times \mathbf{V}_2 =  \begin{vmatrix}
\mathbf{i} & \mathbf{j} & \mathbf{k} \\
\frac{\partial X}{\partial u} &  \frac{\partial Y}{\partial u} & 0 \\
\frac{\partial X}{\partial v} &  \frac{\partial Y}{\partial v} & 0
\end{vmatrix}
$$

<div class='source'>
  Source: <a href='www.subtlepatterns.com'>Background from SubtlePatterns</a>
</div>
Layouts, Custom Metadata
This is a slide with a two column layout.
        ---

## Layouts, Custom Metadata ##

This is a slide with a two column layout.

*** =left

Column 1

*** =right

Column 2
Background Color
This slide should have a subtle gray background.
        ---  bg:#EEE

## Background Color ##

This slide should have a subtle gray background.
Background Image
This slide should have a background image.
        ---  bg:url(../assets/img/grid.png)

## Background Image ##

This slide should have a background image.
Widgets: jQuery-Quiz
This is a multiple choice question
- Choice 1
- Choice 2
- Choice 3 (correct)
- Choice 4
This is a hint
This is the explanation
        ---  &radio .quiz

## Widgets: jQuery-Quiz ##

This is a multiple choice question

1. Choice 1
2. Choice 2
3. _Choice 3 (correct)_
4. Choice 4

*** .hint

This is a hint

*** .explanation

This is the explanation
Widgets: Bootstrap
Blocks
This is an alert info block which should render in blue
Tooltips
This is to check out tooltips in bootstrap you probably
Popover
The font size and color needs some tweaking.
        ---

## Widgets: Bootstrap ##

**Blocks**

<div class="alert alert-info">
 <p>This is an alert info block which should render in blue</p>
</div>

**Tooltips**

This is to check out tooltips in bootstrap <a href="#" rel="tooltip" data-original-title="Default tooltip">you probably</a>

**Popover**

<a class="btn btn-large btn-danger" rel="popover" data-content="And here's some amazing content. It's very engaging. right?" data-original-title="A Title" id='example'>Click to toggle popover</a>

*** =pnotes

The font size and color needs some tweaking.
Highlighter: Highlight JS
We can make this function more robust by adding a simple error checking statement to prevent illegal parameters from generating invalid results.
qpareto <- function(p, scale, loc) {
    if ((scale <= 0) | (loc <= 0)) {
        stop("'qpareto' parameters must be greater than zero.")
    }
    q <- loc * (1 - p)^(-1/scale)
    return(q)
}
Entering a negative parameter now raises an exception, instead of an invalid result that could silently corrupt subsequent results.
qpareto(0.4, 5, -1)
## Error: 'qpareto' parameters must be greater than zero.
We could improve this further by checking to ensure that p is a valid probability.
        ---

## Highlighter: Highlight JS ##

We can make this function more robust by adding a simple error checking statement to prevent illegal parameters from generating invalid results.

```{r echo = T}
qpareto <- function(p, scale, loc) {
  if (( scale <= 0) | ( loc <= 0)) {
    stop("'qpareto' parameters must be greater than zero.")
  }
  q <- loc*(1 - p)^(-1/scale)
  return(q)
}
```

Entering a negative parameter now raises an exception, instead of an invalid result that could silently corrupt subsequent results.

```{r echo = T, error = T}
qpareto(0.4, 5, -1)
```
We could improve this further by checking to ensure that `p` is a valid probability.
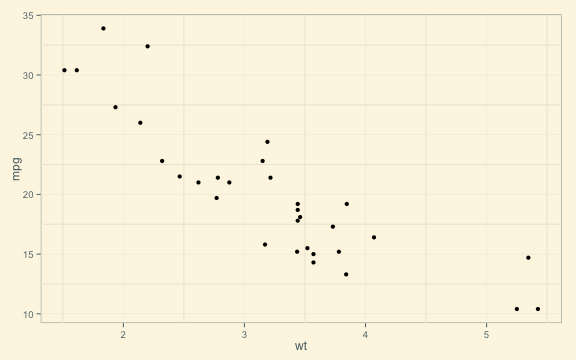
Check Chunk Execution
library(ggplot2)
library(ggthemes)
qplot(wt, mpg, data = mtcars) + theme_solarized()
library(ggplot2)
library(ggthemes)
qplot(wt, mpg, data = mtcars) + theme_solarized()
        ---

## Check Chunk Execution ##

```{r scplot, dev = 'png', fig.width = 8, fig.height = 5, error = T}
library(ggplot2);
library(ggthemes);
qplot(wt, mpg, data = mtcars) +
  theme_solarized()
```

*** =pnotes

```{r ref.label = "scplot", echo = T, eval = F}
```
This is a shout
I am checking key, key
        ---

<q class='shout'>This is a shout</q>

I am checking key, <span class = 'key'>key</span>