Interactive Quiz

Slidify

Ramnath Vaidyanathan

Download

Quiz

The quiz widget allows a user to create interactive quiz questions with Slidify. It makes uses of the jquery-quiz plugin. This widget currently supports the following questions types.

  1. Radio
  2. Checkbox
  3. Multi Text
  4. Submit Compare

Note: You can hit p on any slide to reveal the source
Radio

Eleanor scores 680 on the Mathematics part of the SAT. The distribution of SAT scores in a reference population is Normal, with mean 500 and standard deviation 100. Gerald takes the American College Testing (ACT) Mathematics test and scores 27. ACT scores are Normally distributed with mean 18 and standard deviation 6. Assuming that both tests measure the same kind of ability, who did better?

  1. Eleanor
  2. Gerald

The best way to compare their performance is to calculate their standardized scores.

\[z_E = \frac{680 - 500}{100} = 1.8\] \[z_G = \frac{27 - 18}{6} = 1.5\]

Since, Eleanor has a higher standardized score, we can conclude that Eleanor did better!

Radio (Two Column)

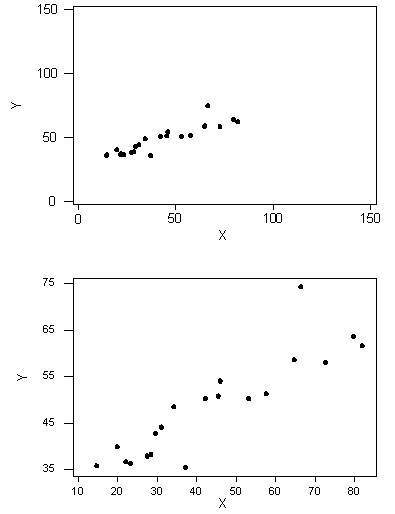
Which of these two scatterplots have a higher correlation?

  1. A
  2. B

Both have the same correlation.

Checkbox

Linda is 31 years old, single, outspoken, and very bright. She majored in philosophy. As a student, she was deeply concerned with issues of discrimination and social justice, and also participated in anti-nuclear demonstrations.

Which is more probable?

  1. Linda is a bank teller.
  2. Linda is a bank teller and is active in the feminist movement.

Think about the probabilities of each event, and that of both of them together.

If you chose (2), stop back and think. Suppose we denote the event of Linda being a teller by A and the event she is active in the feminist movement by B, then probabilities in question can be written as.

  • P(A)
  • \(P(A \cap B)\)

This is called the conjugacy fallacy that occurs when it is assumed that specific conditions are more probable than a single general one.

Multi Text

The length of human pregnancies from conception to birth varies according to a distribution that is approximately Normal with mean 266 days and standard deviation 16 days.

  1. What percent of pregnancies last fewer than 240 days?
  2. What percent of pregnancies last between 240 and 270 days?
  3. How long do the longest 25% pregnancies last?
  1. 5.2081
  2. 54.6625
  3. 276.7918

This is a hint

Submit and Compare

What is the sample space for this experiment?

Submit and Compare Clear

Submit and Compare (2 Column)

The solid curve represents the distribution of heights of all males in the US. The dotted curve represents the distribution of heights reported by males on OkCupid, an online dating website.

What is happening here?

Submit and Compare Clear