rCharts is an R package to create, customize and share interactive visualizations by leveraging javascript libraries.
Interactive Visualizations
rCharts, UseR 2014
Ramnath Vaidyanathan (@ramnath_vaidya)
McGill University
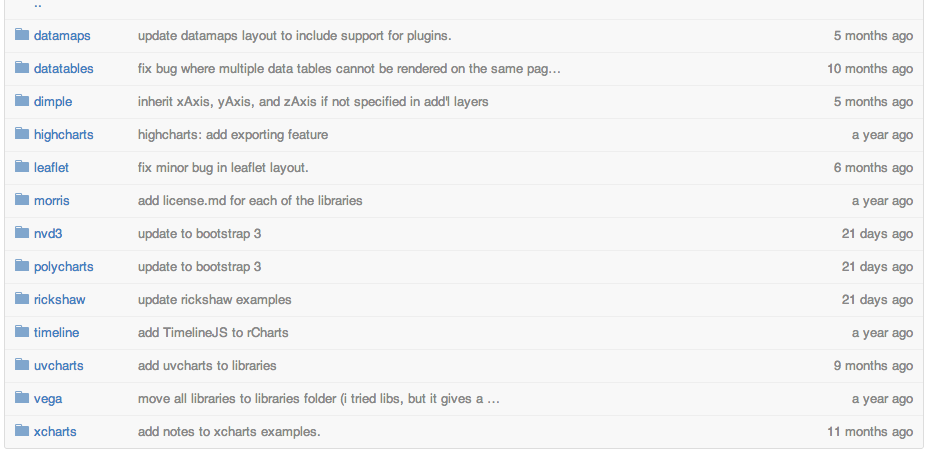
Multiple Libraries Supported
rmeetups = readRDS('data/rmeetups.rds')
L1 <- Mapbox2()
L1$set(width = 1600, height = 800, dom = 'map', map_id = 'ramnathv.i2lkbedb')
L1$setView(c(-30, 130), 2)
L1$set(geojson = toGeoJSON(rmeetups), hover = TRUE)
L1
library(rMaps)
ichoropleth(Crime ~ State, data = violent_crime, animate = "Year")
d1 <- crosslet(
  x = "country",
  y = c("web_index", "universal_access"),
  data = web_index,
  map = map_world(geo = list(url = 'world.topo.json'))
)
d1
More Interactivity
UI
ui = bootstrapPage(
  sidebarPanel(
    selectInput('sex', 'Choose Sex', c('Male', 'Female')),
    selectInput('type', 'Choose Type',
      c('multiBarChart', 'multiBarHorizontalChart')
    )
  ),
  mainPanel(
    chartOutput('nvd3plot', 'nvd3')
  )
)
Server
server = function(input, output){
  output$nvd3plot <- renderChart2({
    haireye <- as.data.frame(HairEyeColor)
    n1 <- nPlot(Freq ~ Hair, group = 'Eye', type = input$type,
      data = subset(haireye, Sex == input$sex)
    )
    n1$set(width = 600)
    n1
  })
}
Interactive Chart with Shiny Controls
Custom Visualizations
Generate Timeline
sachin = readRDS('data/sachin.rds')
m = Timeline$new()
m$main(
  headline =  "100 Centuries of Sachin",
  type = 'default',
  text = "A Tribute to Sachin Tendulkar",
  startDate =  "1990,08,14",
  asset = list(
    media = 'http://www.youtube.com/watch?v=6PxAandi6r4'
  )
)
m$config(font = "Merriweather-Newscycle")
m$event(sachin)
Share Easily
# save
n1$save('mychart.html')
# publish
n1$publish('mychart.html')
How it Works?
uvcharts:
  jshead: [js/d3.v3.min.js, js/uvcharts.js]
  cdn:
    jshead:
      - "http://cdnjs.cloudflare.com/ajax/libs/d3/3.2.2/d3.v3.min.js"
      - "http://imaginea.github.io/uvCharts/js/uvcharts.js"
Layout
<script>
  var graphdef = {{{ chartParams }}}
  var config = {
    meta: {
      position: "#{{ chartId }}"
    }
  }
  var chart = uv.chart(graphdef.type, graphdef, config)
</script>
Data
| Hair | Eye | Sex | Freq | |
|---|---|---|---|---|
| 1 | Black | Brown | Male | 32.00 |
| 2 | Brown | Brown | Male | 53.00 |
| 3 | Red | Brown | Male | 10.00 |
| 4 | Blond | Brown | Male | 3.00 |
| 5 | Black | Blue | Male | 11.00 |
| 6 | Brown | Blue | Male | 50.00 |
| 7 | Red | Blue | Male | 10.00 |
| 8 | Blond | Blue | Male | 30.00 |
| 9 | Black | Hazel | Male | 10.00 |
| 10 | Brown | Hazel | Male | 25.00 |
JSON
"dataset": {
  "Brown": [
    {"name": "Black", "value": 32 },
    {"name": "Brown", "value": 53 },
    {"name": "Red","value":  10},
    {"name": "Blond", "value": 3}
  ],
  "Blue": [
    {"name": "Black", "value": 11 },
    {"name": "Brown", "value": 50 },
    {"name": "Red","value":  10},
    {"name": "Blond", "value": 30}
  ],
  ...
}
Wrap into Function
uPlot <- function(x, y, data, group = NULL, type, ...){
  dataset = make_dataset(x = x, y = y,
    data = data,
    group = group
  )
  u1 <- rCharts$new()
  u1$setLib("uvcharts")
  u1$set(
    type = type,
    categories = names(dataset),
    dataset = dataset
  )
  return(u1)
}
References
Credits
- Kenton Russel and Thomas Reinholdsson for coauthoring rCharts.
- Jeroen Ooms for OpenCPU
- Authors of all the JS Libraries I have liberally used.